RSI/MFI Selling Sentiment IndexPsychological Sales Index (Psychological Sales Index)
Fundamental Indicators of Market Sentiment: The Importance of MFI and RSI
The two fundamental indicators that best reflect market sentiment are Money Flow Index (MFI) and Relative Strength Index (RSI). MFI is an indicator of the flow of funds in a market by combining price and volume, which is used to determine whether a stock is over-bought or over-selling. RSI is an indicator of the overheating of the market by measuring the rise and fall of prices, which is applied to the analysis of the relative strength of stock prices. These two indicators allow a quantitative assessment of the market's buying and selling pressure, which provides important information to understand the psychological state of market participants.
Using timing and fundamental metrics
In order to grasp the effective timing of the sale, in-depth consideration was needed on how to use basic indicators. MFI and RSI represent the buying and selling pressures of the market, respectively, but there is a limit to reflecting the overall trend of the market alone. As a result, a study on how to capture more accurate selling points was conducted by comprehensively considering technical analysis along with psychological factors of the market.
The importance of ADX integration and weighting
The "Average Regional Index (ADX)" was missing in the early version. ADX is an indicator of the strength of a trend, and has experienced a problem of less accuracy in selling sentiment indicators, especially in the upward trend. To address this, we incorporated ADX and adopted a method of adjusting the weights of MFI and RSI according to the values of ADX. A high ADX value implies the existence of a strong trend, in which case it is appropriate to reduce the influence of MFI and RSI to give more importance to the strength of the trend. Conversely, a low ADX value increases the influence of MFI and RSI, putting more weight on the psychological elements of the market.
How to use and interpret
The user can adjust several parameters. Key inputs include 'Length', 'Overbought Threshold', 'DI Length', and 'ADX Smoothing'. These parameters are used to set the calculation period, overselling threshold, DI length, and ADX smoothing period of the indicator, respectively. The script calculates the psychological selling index based on MFI, RSI, and ADX. The calculated index is normalized to values between 0 and 100 and is displayed in the graph. Values above 'Overbought Threshold' indicate an overselling state, which can be interpreted as a potential selling signal. This index allows investors to comprehensively evaluate the psychological state of the market and the strength of trends, which can be used to make more accurate selling decisions.
Cerca negli script per "relative strength"

MADALGO's Fear and Greed OscillatorThe Fear and Greed Oscillator is a dynamic tool designed to gauge market sentiment by analyzing various components such as volatility, momentum, and volume. This indicator synthesizes multiple metrics to provide a singular view of market emotion, oscillating between fear and greed.
🔷 Calculation -
The oscillator integrates the following components, each normalized and weighted to contribute equally:
ATR (Average True Range): Represents market volatility.
MACD (Moving Average Convergence Divergence): Captures market momentum.
RSI (Relative Strength Index): Provides insights into overbought or oversold conditions.
Volume: Reflects market participation levels.
Each component is first normalized to ensure a balanced impact and then averaged to create the final oscillator value.
🔷 Color Coding -
The oscillator's plot changes color based on its value, representing market sentiment:
Green: Indicates a leaning towards greed.
Red: Suggests a leaning towards fear.
The intensity of the color represents the strength of the sentiment.
🔷 Usage -
This indicator is valuable for traders looking to understand market sentiment. It works best when combined with other forms of analysis, such as fundamental or other technical indicators, to form a comprehensive trading strategy.
🔷 Signal Lines -
Two horizontal lines represent extreme conditions:
A line for Extreme Fear.
Another for Extreme Greed.
These lines help identify when the market sentiment is at potentially unsustainable levels.
🔷 Customization -
The Fear and Greed Oscillator is designed with flexibility in mind, allowing users to adjust several parameters to match their specific analysis requirements. Understanding and utilizing these customization options can significantly enhance the indicator's relevance and effectiveness in various market conditions.
1. Length Parameters:
ATR and RSI Length: This input determines the period over which the Average True Range (ATR) and the Relative Strength Index (RSI) are calculated. Adjusting this length can affect the sensitivity of the oscillator to recent market movements. A shorter length makes the oscillator more responsive to recent changes, while a longer length smoothens it, reducing sensitivity to short-term fluctuations.
MACD Parameters: These include the Fast Length, Slow Length, and Signal Smoothing. By adjusting these, users can control how the Moving Average Convergence Divergence (MACD) component reacts to price movements. This customization is crucial for aligning the oscillator with different trading strategies, whether short-term or long-term focused.
Volume Length: This parameter sets the period for the moving average and standard deviation calculations of the volume component. Altering this length allows the oscillator to either emphasize recent volume changes or consider a broader historical context.
2. Weight Adjustments:
Component Weights: Each component (ATR, MACD, RSI, Volume) has an associated weight factor. These weights determine the relative influence of each component on the final oscillator value. Users can increase the weight of a component to give it more influence or decrease it to lessen its impact. This feature is particularly beneficial for traders who have a preference or insight into which market aspects are more indicative of fear or greed at given times.
Balancing the Components: The key to effective customization lies in balancing these weights to reflect the user's market perspective and trading style. For instance, a trader focusing on volatility might increase the weight of the ATR, while one interested in momentum might prioritize the MACD and RSI weights.
3. Color and Signal Line Customization:
Color Intensity: The intensity of the color gradient of the oscillator line can be a visual aid in quickly identifying market sentiment. Users can experiment with the colorValue calculation within the script to adjust how rapidly the color changes with the oscillator values
Extreme Levels: The extreme fear and greed levels, represented by horizontal lines, are customizable. Users can set these levels based on historical data analysis or personal risk tolerance. These lines act as alerts for potentially overextended market conditions.
🔷 Limitations -
As with any technical tool, the Fear and Greed Oscillator should not be used in isolation. It does not predict market direction but rather gauges the prevailing market emotion. Its effectiveness may vary across different markets and timeframes.
🔷 Conclusion -
The Fear and Greed Oscillator offers a unique perspective on market sentiment, encapsulating various aspects of market behavior into a single indicator. It serves as a versatile tool for traders aiming to understand the emotional undercurrents of the market.
🔷 Risk Disclaimer -
Financial trading involves significant risk. The value of investments can fluctuate, and past performance is not indicative of future results. This indicator is for informational purposes and should not be construed as financial advice. Always consider your personal circumstances and seek independent advice before making financial decisions.

RMI Trend Sync - Strategy [presentTrading]█ Introduction and How It Is Different
The "RMI Trend Sync - Strategy " combines the strength of the Relative Momentum Index (RMI) with the dynamic nature of the Supertrend indicator. This strategy diverges from traditional methodologies by incorporating a dual analytical framework, leveraging both momentum and trend indicators to offer a more holistic market perspective. The integration of the RMI provides an enhanced understanding of market momentum, while the Super Trend indicator offers clear insights into the end of market trends, making this strategy particularly effective in diverse market conditions.
BTC 4h long/short performance
█ Strategy: How It Works - Detailed Explanation
- Understanding the Relative Momentum Index (RMI)
The Relative Momentum Index (RMI) is an adaptation of the traditional Relative Strength Index (RSI), designed to measure the momentum of price movements over a specified period. While RSI focuses on the speed and change of price movements, RMI incorporates the direction and magnitude of those movements, offering a more nuanced view of market momentum.
- Principle of RMI
Calculation Method: RMI is calculated by first determining the average gain and average loss over a given period (Length). It differs from RSI in that it uses the price change (close-to-close) rather than absolute gains or losses. The average gain is divided by the average loss, and this ratio is then normalized to fit within a 0-100 scale.
- Momentum Analysis in the Strategy
Thresholds for Decision Making: The strategy uses predetermined thresholds (pmom for positive momentum and nmom for negative momentum) to trigger trading decisions. When RMI crosses above the positive threshold and other conditions align (e.g., a bullish trend), it signals a potential long entry. Similarly, crossing below the negative threshold in a bearish trend may trigger a short entry.
- Super Trend and Trend Analysis
The Super Trend indicator is calculated based on a higher time frame, providing a broader view of the market trend. This indicator uses the Average True Range (ATR) to adapt to market volatility, making it an effective tool for identifying trend reversals.
The strategy employs a Volume Weighted Moving Average (VWMA) alongside the Super Trend, enhancing its capability to identify significant trend shifts.
ETH 4hr long/short performance
█ Trade Direction
The strategy offers flexibility in selecting the trading direction: long, short, or both. This versatility allows traders to adapt to their market outlook and risk tolerance, whether looking to capitalize on bullish trends, bearish trends, or a combination of both.
█ Usage
To effectively use the "RMI Trend Sync" strategy, traders should first set their preferred trading direction and adjust the RMI and Super Trend parameters according to their risk appetite and trading goals.
The strategy is designed to adapt to various market conditions, making it suitable for different asset classes and time frames.
█ Default Settings
RMI Settings: Length: 21, Positive Momentum Threshold: 70, Negative Momentum Threshold: 30
Super Trend Settings: Length: 10, Higher Time Frame: 480 minutes, Super Trend Factor: 3.5, MA Source: WMA
Visual Settings: Display Range MA: True, Bullish Color: #00bcd4, Bearish Color: #ff5252
Additional Settings: Band Length: 30, RWMA Length: 20

Goldmine Wealth Builder - DKK/SKKGoldmine Wealth Builder
Version 1.0
Introduction to Long-Term Investment Strategies: DKK, SKK1 and SKK2
In the dynamic realm of long-term investing, the DKK, SKK1, and SKK2 strategies stand as valuable pillars. These strategies, meticulously designed to assist investors in building robust portfolios, combine the power of Super Trend, RSI (Relative Strength Index), Exponential Moving Averages (EMAs), and their crossovers. By providing clear alerts and buy signals on a daily time frame, they equip users with the tools needed to make well-informed investment decisions and navigate the complexities of the financial markets. These strategies offer a versatile and structured approach to both conservative and aggressive investment, catering to the diverse preferences and objectives of investors.
Each part of this strategy provides a unique perspective and approach to the accumulation of assets, making it a versatile and comprehensive method for investors seeking to optimize their portfolio performance. By diligently applying this multi-faceted approach, investors can make informed decisions and effectively capitalize on potential market opportunities.
DKK Strategy for ETFs and Funds:
The DKK system is a strategy designed for accumulating ETFs and Funds as long-term investments in your portfolio. It simplifies the process of identifying trend reversals and opportune moments to invest in listed ETFs and Funds, particularly during bull markets. Here's a detailed explanation of the DKK system:
Objective: The primary aim of the DKK system is to build a long-term investment portfolio by focusing on ETFs and Funds. It facilitates the identification of stocks that are in the process of reversing their trends, allowing investors to benefit from upward price movements in these financial instruments.
Stock Selection Criteria: The DKK system employs specific criteria for selecting ETFs and Funds:
• 200EMA (Exponential Moving Average): The system monitors whether the prices of ETFs and Funds are consistently below the 200-day Exponential Moving Average. This is considered an indicator of weakness, especially on a daily time frame.
• RSI (Relative Strength Index): The system looks for an RSI value of less than 40. An RSI below 40 is often seen as an indication of a weak or oversold condition in a financial instrument.
Alert Signal: Once the DKK system identifies ETFs and Funds meeting these criteria, it provides an alert signal:
• Red Upside Triangle Sign: This signal is automatically generated on the daily chart of ETFs and Funds. It serves as a clear indicator to investors that it's an opportune time to accumulate these financial instruments for long-term investment.
It's important to note that the DKK system is specifically designed for ETFs and Funds, so it should be applied to these types of investments. Additionally, it's recommended to track index ETFs and specific types of funds, such as REITs (Real Estate Investment Trusts) and INVITs (Infrastructure Investment Trusts), in line with the DKK system's approach. This strategy simplifies the process of identifying investment opportunities within this asset class, particularly during periods of market weakness.
SKK1 Strategy for Conservative Stock Investment:
The SKK 1 system is a stock investment strategy tailored for conservative investors seeking long-term portfolio growth with a focus on stability and prudent decision-making. This strategy is meticulously designed to identify pivotal market trends and stock price movements, allowing investors to make informed choices and capitalize on upward market trends while minimizing risk. Here's a comprehensive overview of the SKK 1 system, emphasizing its suitability for conservative investors:
Objective: The primary objective of the SKK 1 system is to accumulate stocks as long-term investments in your portfolio while prioritizing capital preservation. It offers a disciplined approach to pinpointing potential entry points for stocks, particularly during market corrections and trend reversals, thereby enabling you to actively participate in bullish market phases while adopting a conservative risk management stance.
Stock Selection Criteria: The SKK 1 system employs a stringent set of criteria to select stocks for investment:
• Correction Mode: It identifies stocks that have undergone a correction, signifying a decline in stock prices from their recent highs. This conservative approach emphasizes the importance of seeking stocks with a history of stability.
• 200EMA (Exponential Moving Average): The system diligently analyses daily stock price movements, specifically looking for stocks that have fallen to or below the 200-day Exponential Moving Average. This indicator suggests potential overselling and aligns with a conservative strategy of buying low.
Trend Reversal Confirmation: The SKK 1 system doesn't merely pinpoint stocks in correction mode; it takes an extra step to confirm a trend reversal. It employs the following indicators:
• Short-term Downtrends Reversal: This aspect focuses on identifying the reversal of short-term downtrends in stock prices, observed through the transition of the super trend indicator from the red zone to the green zone. This cautious approach ensures that the trend is genuinely shifting.
• Super Trend Zones: These zones are crucial for assessing whether a stock is in a bullish or bearish trend. The system consistently monitors these zones to confirm a potential trend reversal.
Alert & Buy Signals: When the SKK 1 system identifies stocks that have reached a potential bottom and are on the verge of a trend reversal, it issues vital alert signals, aiding conservative investors in prudent decision-making:
• Orange Upside Triangle Sign: This signal serves as a cautious heads-up, indicating that a stock may be poised for a trend reversal. It advises investors to prepare funds for potential investment without taking undue risks.
• Green Upside Triangle Sign: This is the confirmation of a trend reversal, signifying a robust buy signal. Conservative investors can confidently enter the market at this point, accumulating stocks for a long-term investment, secure in the knowledge that the trend is in their favor.
In summary, the SKK 1 system is a systematic and conservative approach to stock investing. It excels in identifying stocks experiencing corrections and ensures that investors act when there's a strong indication of a trend reversal, all while prioritizing capital preservation and risk management. This strategy empowers conservative investors to navigate the intricacies of the stock market with confidence, providing a calculated and stable path toward long-term portfolio growth.
Note: The SKK1 strategy, known for its conservative approach to stock investment, also provides an option to extend its methodology to ETFs and Funds for those investors who wish to accumulate assets more aggressively. By enabling this feature in the settings, you can harness the SKK1 strategy's careful criteria and signal indicators to accumulate aggressive investments in ETFs and Funds.
This flexible approach acknowledges that even within a conservative strategy, there may be opportunities for more assertive investments in assets like ETFs and Funds. By making use of this option, you can strike a balance between a conservative stance in your stock portfolio while exploring an aggressive approach in other asset classes. It offers the versatility to cater to a variety of investment preferences, ensuring that you can adapt your strategy to suit your financial goals and risk tolerance.
SKK 2 Strategy for Aggressive Stock Investment:
The SKK 2 strategy is designed for those who are determined not to miss significant opportunities within a continuous uptrend and seek a way to enter a trend that doesn't present entry signals through the SKK 1 strategy. While it offers a more aggressive entry approach, it is ideal for individuals willing to take calculated risks to potentially reap substantial long-term rewards. This strategy is particularly suitable for accumulating stocks for aggressive long-term investment. Here's a detailed description of the SKK 2 strategy:
Objective: The primary aim of the SKK 2 strategy is to provide an avenue for investors to identify short-term trend reversals and seize the opportunity to enter stocks during an uptrend, thereby capitalizing on a sustained bull run. It acknowledges that there may not always be clear entry signals through the SKK 1 strategy and offers a more aggressive alternative.
Stock Selection Criteria: The SKK 2 strategy utilizes a specific set of criteria for stock selection:
1. 50EMA (Exponential Moving Average): It targets stocks that are trading below the 50-day Exponential Moving Average. This signals a short-term reversal from the top and indicates that the stock is in a downtrend.
2. RSI (Relative Strength Index): The strategy considers stocks with an RSI of less than 40, which is an indicator of weakness in the stock.
Alert Signals: The SKK 2 strategy provides distinct alert signals that facilitate entry during an aggressive reversal:
• Red Downside Triangle Sign: This signal is triggered when the stock is below the 50EMA and has an RSI of less than 40. It serves as a clear warning of a short-term reversal from the top and a downtrend, displayed on the daily chart.
• Purple Upside Triangle Sign: This sign is generated when a reversal occurs through a bullish candle, and the RSI is greater than 40. It signifies the stock has bottomed out from a short-term downtrend and is now reversing. This purple upside triangle serves as an entry signal on the chart, presenting an attractive opportunity to accumulate stocks during a strong bullish phase, offering a chance to seize a potentially favorable long-term investment.
In essence, the SKK 2 strategy caters to aggressive investors who are willing to take calculated risks to enter stocks during a continuous uptrend. It focuses on identifying short-term reversals and provides well-defined signals for entry. While this strategy is more aggressive in nature, it has the potential to yield substantial rewards for those who are comfortable with a higher level of risk and are looking for opportunities to build a strong long-term portfolio.
Introduction to Strategy Signal Information Chart
This chart provides essential information on strategy signals for DKK, SKK1, and SKK2. By quickly identifying "Buy" and "Alert" signals for each strategy, investors can efficiently gauge market conditions and make informed decisions to optimize their investment portfolios.
In Conclusion
These investment strategies, whether conservative like DKK and SKK1 or more aggressive like SKK2, offer a range of options for investors to navigate the complex world of long-term investments. The combination of Super Trend, RSI, and EMAs with their crossovers provides clear signals on a daily time frame, empowering users to make well-informed decisions and potentially capitalize on market opportunities. Whether you're looking for stability or are ready to embrace more risk, these strategies have something to offer for building and growing your investment portfolio.

Zaree - RSI Gradient FillDescription:
The "Zaree - RSI Gradient Fill" (RGF) indicator is a technical analysis tool designed to enhance the interpretation of the Relative Strength Index (RSI) by incorporating visual cues through gradient fill. This indicator aids traders in identifying potential overbought and oversold conditions in the market using the RSI as a key reference.
Details of the Indicator:
The indicator calculates the RSI of a selected source based on user-defined settings for length and source.
Traders have the option to choose from various types of moving averages (SMA, EMA, SMMA, WMA) to calculate the RSI.
RSI values and their corresponding moving average values are plotted on the chart for visual analysis.
The indicator offers customization through input settings for RSI length, RSI source, and moving average type and length.
Upper and lower bands for the RSI are displayed on the chart, providing visual cues for potential overbought and oversold conditions.
A center line is plotted on the chart to help traders identify the equilibrium point of the RSI.
The gradient fill feature enhances the visualization by coloring the space between the RSI plot and the center line based on RSI levels.
How to Use the Indicator:
Specify the RSI length and source for calculation.
Choose the desired moving average type and set the length for the moving average.
Observe the RSI values, moving average lines, and the center line plotted on the chart.
Pay attention to the position of the RSI values relative to the upper and lower bands. Values above the upper band suggest potential overbought conditions, while values below the lower band indicate potential oversold conditions.
Interpret the gradient fill between the RSI plot and the center line. The color changes provide additional visual cues about the RSI's strength compared to the center line.
Example of Usage:
As an experienced swing trader, you can leverage the RGF indicator to fine-tune your trading decisions. Here's an example of how you might use the indicator:
Select your preferred RSI length and source, such as the closing price.
Choose "SMA" as the moving average type and set the length to 14.
Observe the RSI values plotted on the chart along with the upper and lower bands.
Pay special attention to the gradient fill between the RSI plot and the center line. This coloring offers valuable insights into the RSI's position relative to equilibrium.
Look for instances where the RSI values cross above or below the upper and lower bands. These crossings can signal potential trend shifts or reversals.
Use the gradient fill colors to quickly assess the strength of the RSI's deviation from the center line.
Remember that the RGF indicator is a powerful tool to complement your trading strategy. Consider combining its insights with other technical and fundamental analyses for well-informed trading decisions.
Feel free to adjust the indicator settings according to your trading preferences and style. While the RGF indicator provides valuable visual cues, always consider the broader context of the market before making trading choices.

StatBox📊 StatBox: A Comprehensive Trading Indicator for RSI, Volume Percent, and ADD 📈💼
Introducing StatBox, the ultimate trading indicator designed to provide traders with a powerful analytical toolset for making informed trading decisions. With StatBox, you gain access to real-time data on Relative Strength Index (RSI), Volume Percent, and ADD (Advance/Decline Differential). This dynamic combination of indicators empowers you to navigate the market with greater precision and confidence. 📊🔍
Key Features of StatBox:
1️⃣ RSI (Relative Strength Index): RSI is a widely recognized momentum oscillator that measures the speed and change of price movements. StatBox displays RSI as a numerical value, ranging from 0 to 100, allowing you to quickly assess whether a security is overbought or oversold. This information is invaluable for identifying potential reversal points and optimizing entry or exit strategies.
2️⃣ Volume Percent: StatBox provides a visual representation of the Volume Percent, which reflects the relative trading volume compared to a specified period. By monitoring volume dynamics, you gain insights into market sentiment and potential price trends. A higher volume percentage often indicates stronger market participation, suggesting increased interest in a particular security.
3️⃣ ADD (Advance/Decline Differential): ADD is a breadth indicator that calculates the difference between advancing (upward moving) and declining (downward moving) securities. StatBox presents ADD as a histogram, enabling you to assess the overall strength or weakness of the market. Positive values indicate bullish sentiment, while negative values suggest bearish sentiment. By tracking ADD, you can identify potential market reversals or confirm existing trends.
With StatBox, you can:
✅ Quickly gauge the overbought or oversold conditions of a security using RSI.
✅ Monitor volume dynamics to assess market sentiment and potential price trends.
✅ Analyze the breadth of the market and identify bullish or bearish signals with ADD.
✅ Make well-informed trading decisions based on a comprehensive view of multiple indicators.
StatBox provides a user-friendly interface, allowing you to seamlessly integrate it into your preferred trading platform or charting software. Its intuitive design and real-time data updates ensure you have the most accurate and up-to-date information at your fingertips.
Upgrade your trading arsenal and unlock the potential of RSI, Volume Percent, and ADD with StatBox. Experience the power of multiple indicators in a single comprehensive tool. Download StatBox today and gain a competitive edge in the dynamic world of trading! 🚀📈

Net Positions (Net Longs & Net Shorts) - By LeviathanThis script is an experimental indicator that visualizes the entering and exiting of long and short positions in the market. It also includes other useful tools, such as NL/NS Profile, NL/NS Delta, NL/NS Ratio, Volume Heatmap, Divergence finder, Relative Strength Index of Net Longs and Net Shorts, EMAs and VWMAs and more.
To avoid misinterpretation, it's important to understand some basics. The “real” ratio between net long and net short positions in a given market is always 1:1. A futures contract is an agreement between two parties to buy or sell an underlying asset at an agreed-upon price. Each contract has a long side and a short side, with one party agreeing to buy (long) and the other party agreeing to sell (short) the asset at the agreed-upon price. The long position holder anticipates that the asset's price will rise, while the short position holder expects it to fall. Because every futures contract involves both a buyer and a seller, it is impossible to have more net longs than net shorts or vice versa (in terms of the net value). For every long position opened, there must be a corresponding short position taken by another market participant (and vice versa), thus maintaining the 1:1 ratio between longs and shorts. While there can be an imbalance in the number of traders/accounts holding long and short contracts, the net value of positions held on each side remains 1 to 1.
Open Interest (OI) is a metric that tracks the number of open (unsettled) contracts in a given market. For example, Open Interest of 100 BTC means that there are currently 100 BTC worth of longs and 100 BTC worth of shorts open in the market. There may be more traders on one side holding smaller positions, and fewer traders on the other side holding larger positions, but the net value of positions on one side is equal to the net value of positions on the other side → 100 BTC in longs and 100 BTC in shorts (1:1). Consider a scenario in which a trader decides to open a long position for 1 BTC at a price of HKEX:30 ,000. For this long order to be executed, a counterparty must take the opposite side of the contract by placing an order to short 1 BTC at the same price of HKEX:30 ,000. When both the long and short orders are matched and executed, the open interest increases by 1 BTC, reflecting the addition of this new contract to the market.
Changes in Open Interest essentially tell us 3 things:
- OI Increase - new positions entered the market (both longs and shorts!)
- OI Decrease - positions exited the market (both longs and shorts!)
- OI Flat - no change in open positions due to low activity or simply lots of transfers of contracts
However, different concepts can be used to analyze sentiment, aggressiveness, and activity in the market by analyzing data such as Open Interest, price, volume, etc. This indicator combines Open Interest data and price action to simplify the visualization of positions entering and exiting the market. It is based on the following concept:
Increase in Open Interest + Increase in price = Longs Opening
Decrease in Open Interest + Decrease in price = Longs Closing
Increase in Open Interest + Decrease in price = Shorts Opening
Decrease in Open Interest + Increase in price = Shorts Closing
When "Longs Opening" occurs, the OI Delta value is added to the running total of Net Longs, and when "Longs Closing" occurs, the OI Delta value is subtracted from the running total of Net Longs.
When "Shorts Opening" occurs, the OI Delta value is added to the running total of Net Shorts, and when "Shorts Closing" occurs, the OI Delta value is subtracted from the running total of Net Shorts.
To summarize:
Net Longs: Cumulative value of Longs Opening and Longs Closing (LO - LC)
Net Shorts: Cumulative value of Shorts Opening and Shorts Closing (SO - SC)
Net Delta: Net Longs - Net Shorts
Net Ratio: Net Longs / Net Shorts
This is the fundamental logic of how this script functions, but it also includes several other tools and options. Here is an overview of the settings:
Type:
- Net Positions (display values of Net Longs, Net Shorts, Net Delta, Net Ratio as described above)
- Relative Strength (display Net Longs, Net Shorts, Net Delta, Net Ratio in the form of a momentum oscillator that measures the speed and change of movements. Same logic as RSI for price)
Display as:
- Candles (display the data in the form of candlesticks)
- Lines (display the data in the form of candlesticks)
- Columns (display the data in the form of columns)
Cumulation:
- Visible Range (data is cumulated from the first visible bar on your chart)
- Full Data (data is cumulated from the beginning)
Quoted in:
- Base Currency (all data is presented in the pair’s base currency eg. BTC)
- Quote Currency (all data is presented in the pair’s quote currency eg USDT)
OI Sources
- Pick the sources from where the data is collected (if available).
Net Positions:
- NET LONGS (show/hide Net Longs plot, choose candle colors, choose line color)
- NET SHORTS (show/hide Net Shorts plot, choose candle colors, choose line color)
- NET DELTA (show/hide Net Delta plot, choose candle colors, choose line color)
- NET RATIO (show/hide Net Ratio plot, choose candle colors, choose line color)
Moving Averages:
- Type (choose between EMA and Volume Weighted Moving Average)
- NET LONGS (show/hide NL moving average plot, choose length, choose color)
- NET SHORTS (show/hide NS moving average plot, choose length, choose color)
- NET DELTA (show/hide ND moving average plot, choose length, choose color)
- NET RATIO (show/hide NR moving average plot, choose length, choose color)
Profile:
- Profile Data (choose the source data of the profile)
- Value Area % (set the percentage width of profile’s value area)
- Positions (set the position of the profile to left or right of the visible range)
- Node Size (set the relative size of nodes to make them appear smaller or larger)
- Rows (select the amount of rows displayed by the profile to control granularity)
- POC (show/hide POC- Point Of Control and select its color)
- VA (show/hide VA- Value Area and select its color)
Divergence finder
- Source (choose the source data used by the script to compare it with price pivot points)
- Maximum distance (the maximum distance between two divergent pivot points)
- Lookback Bars Left (the number of bars to the left of the current bar that the function will consider when looking for a pivot point)
- Lookback Bars Right (the number of bars to the right of the current bar that the function will consider when looking for a pivot point)
Stats:
- Show/Hide the Stats table
- Bars Back (choose the length of data analyzed for stats in number of bars)
- Position (choose the position of the Stats table)
- Select Data you want to display in the Stats table
Additional Settings:
- Volume Heatmap (show/hide volume heatmap and select its color)
- Label Offset (select how much the plot label is shifted to the right
- Position Relative Strength Length (select the length used in the calculation)
- Value Label (show/hide OI Delta values when candles are displayed)
- Plot Labels (show/hide the labels next to the plot)
- Wicks (show/hide wick when candles are displayed)
Code used for generating profiles is taken from @KioseffTrading's "Profile Any Indicator" script (used with author's permission)

On-Chart QQE of RSI on Variety MA [Loxx]On-Chart QQE of RSI on Variety MA (Quantitative Qualitative Estimation) is usually calculated using RSI. This version is uses an RSI of a Moving Average instead. The results are completely different than the original QQE. Also, this version is drawn directly on chart. There are four types of signals.
What is QQE?
Quantitative Qualitative Estimation (QQE) is a technical analysis indicator used to identify trends and trading opportunities in financial markets. It is based on a combination of two popular technical analysis indicators - the Relative Strength Index (RSI) and Moving Averages (MA).
The QQE indicator uses a smoothed RSI to determine the trend direction, and a moving average of the smoothed RSI to identify potential trend changes. The indicator then plots a series of bands above and below the moving average to indicate overbought and oversold conditions in the market.
The QQE indicator is designed to provide traders with a reliable signal that confirms the strength of a trend or indicates a possible trend reversal. It is particularly useful for traders who are looking to trade in markets that are trending strongly, but also want to identify when a trend is losing momentum or reversing.
Traders can use QQE in a number of different ways, including as a confirmation tool for other indicators or as a standalone indicator. For example, when used in conjunction with other technical analysis tools like support and resistance levels, the QQE indicator can help traders identify key entry and exit points for their trades.
One of the main advantages of the QQE indicator is that it is designed to be more reliable than other indicators that can generate false signals. By smoothing out the price action, the QQE indicator can provide traders with more accurate and reliable signals, which can help them make more profitable trading decisions.
In conclusion, QQE is a popular technical analysis indicator that traders use to identify trends and trading opportunities in financial markets. It combines the RSI and moving average indicators and is designed to provide traders with reliable signals that confirm the strength of a trend or indicate a possible trend reversal.
What is RSI?
RSI stands for Relative Strength Index . It is a technical indicator used to measure the strength or weakness of a financial instrument's price action.
The RSI is calculated based on the price movement of an asset over a specified period of time, typically 14 days, and is expressed on a scale of 0 to 100. The RSI is considered overbought when it is above 70 and oversold when it is below 30.
Traders and investors use the RSI to identify potential buy and sell signals. When the RSI indicates that an asset is oversold, it may be considered a buying opportunity, while an overbought RSI may signal that it is time to sell or take profits.
It's important to note that the RSI should not be used in isolation and should be used in conjunction with other technical and fundamental analysis tools to make informed trading decisions.
This indicator makes use of the following libraries:
Loxx's Moving Averages
Loxx's Expanded Source Types
Extras
Alerts
Signals
Signal Types
Change on Levels
Change on Slope
Change on Zero
Change on Original

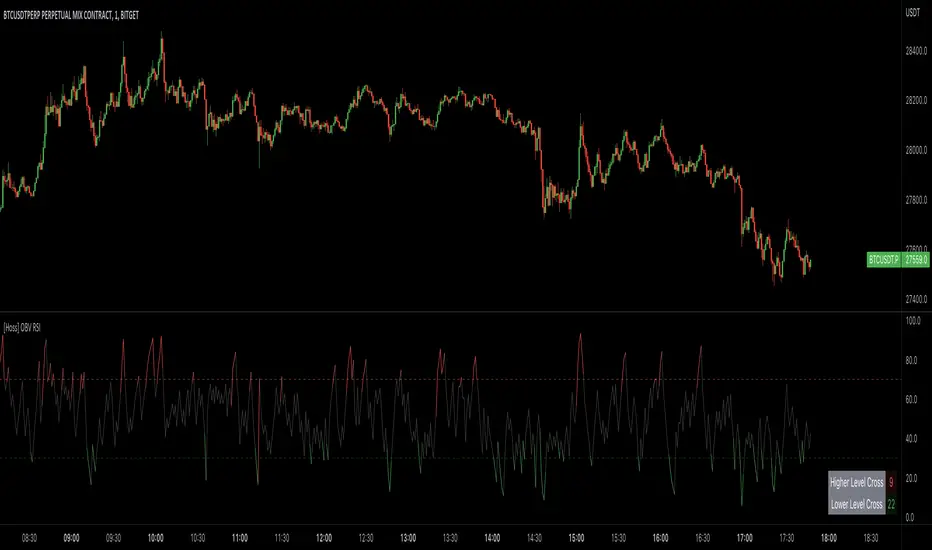
[Hoss] OBV RSIThe OBV ( On Balance Volume ) RSI ( Relative Strength Index ) indicator is an innovative tool that combines the power of OBV and RSI to provide traders with a comprehensive view of the market's momentum and volume dynamics. This combination enables users to make better-informed trading decisions by analyzing the relationship between price, volume , and relative strength .
The script starts by calculating the On Balance Volume , which is a cumulative volume-based indicator that measures buying and selling pressure. The OBV increases when the closing price is higher than the previous closing price and decreases when the closing price is lower than the previous closing price. This helps traders identify potential price trend reversals based on volume accumulation or distribution.
Next, the script computes the Relative Strength Index ( RSI ) based on the OBV values, offering a unique perspective on the market's momentum through the lens of volume . The RSI is a popular momentum indicator that ranges from 0 to 100 and helps traders identify overbought and oversold conditions. In this script, the user can define the RSI length and the higher and lower levels (default values are 70 and 30, respectively).
A distinctive feature of this OBV RSI indicator is the addition of a monitor that counts the number of times the RSI crosses above the higher level and below the lower level within a user-defined lookback period. This monitor is displayed as a table in the bottom right corner of the chart and can be enabled or disabled through an input option.
The cross count monitor provides valuable insights into the historical frequency of RSI crossings, helping traders to identify potential trading opportunities based on historical price behavior around these levels.
swami_rsi
Description:
As in the practices, most traders find it hard to set the proper lookback period of the indicator to be used. SwamiCharts offers a comprehensive way to visualize the indicator used over a range of lookback periods. The SwamiCharts of Relative Strength Index (RSI), was developed by Ehlers - see Cycle Analytics for Traders, chapter 16. The indicator was computed over multiple times of the range of lookback period for the Relative Strength Index (RSI), from the deficient period to the relatively high lookback period i.e. 1 to 48, then plotted as one heatmap.
Features:
In this indicator, the improvement is to utilize the color(dot)rgb() function, which finds to giving a relatively lower time to compute, and follows the original color scheme.
The confirmation level, which assumed of 25

[blackcat] L3 RMI Trading StrategyLevel 3
Background
My view of correct usage of RSI and the relationship between RMI and RSI. A proposed RMI indicator with features is introduced
Descriptions
The Relative Strength Index (RSI) is a technical indicator that many people use. Its focus indicates the strength or weakness of a stock. In the traditional usage of this point, when the RSI is above 50, it is strong, otherwise it is weak. Above 80 is overbought, below 20 is oversold. This is what the textbook says. However, if you follow the principles in this textbook and enter the actual trading, you would lose a lot and win a little! What is the reason for this? When the RSI is greater than 50, that is, a stock enters the strong zone. At this time, the emotions of market may just be brewing, and as a result, you run away and watch others win profit. On the contrary, when RSI<20, that is, a stock enters the weak zone, you buy it. At this time, the effect of losing money is spreading. You just took over the chips that were dumped by the whales. Later, you thought that you had bought at the bottom, but found that you were in half mountainside. According to this cycle, there is a high probability that a phenomenon will occur: if you sell, price will rise, and if you buy, price will fall, who have similar experiences should quickly recall whether their RSI is used in this way. Technical indicators are weapons. It can be either a tool of bull or a sharp blade of bear. Don't learn from dogma and give it away. Trading is a game of people. There is an old saying called “people’s hearts are unpredictable”. Do you really think that there is a tool that can detect the true intentions of people’s hearts 100% of the time?
For the above problems, I suggest that improvements can be made in two aspects (in other words, once the strategy is widely spread, it is only a matter of time before it fails. The market is an adaptive and complex system, as long as it can be fully utilized under the conditions that can be used, it is not easy to use. throw or evolve):
1. RSI usage is the opposite. When a stock has undergone a deep adjustment from a high level, and the RSI has fallen from a high of more than 80 to below 50, it has turned from strong to weak, and cannot be bought in the short term. But when the RSI first moved from a low to a high of 80, it just proved that the stock was in a strong zone. There are funds in the activity, put into the stock pool.
Just wait for RSI to intervene in time when it shrinks and pulls back (before it rises when the main force washes the market). It is emphasized here that the use of RSI should be combined with trading volume, rising volume, and falling volume are all healthy performances. A callback that does not break an important moving average is a confirmed buying point or a second step back on an important moving average is a more certain buying point.
2. The RSI is changed to a more stable and adjustable RMI (Relative Momentum Indicator), which is characterized by an additional momentum parameter, which can not only be very close to the RSI performance, but also adjust the momentum parameter m when the market environment changes to ensure more A good fit for a changing market.
The Relative Momentum Index (RMI) was developed by Roger Altman and described its principles in his article in the February 1993 issue of the journal Technical Analysis of Stocks and Commodities. He developed RMI based on the RSI principle. For example, RSI is calculated from the close to yesterday's close in a period of time compared to the ups and downs, while the RMI is compared from the close to the close of m days ago. Therefore, in principle, when m=1, RSI should be equal to RMI. But it is precisely because of the addition of this m parameter that the RMI result may be smoother than the RSI.
Not much more to say, the below picture: when m=1, RMI and RSI overlap, and the result is the same.
The Shanghai 50 Index is from TradingView (m=1)
The Shanghai 50 Index is from TradingView (m=3)
The Shanghai 50 Index is from TradingView (m=5)
For this indicator function, I also make a brief introduction:
1. 50 is the strength line (white), do not operate offline, pay attention online. 80 is the warning line (yellow), indicating that the stock has entered a strong area; 90 is the lightening line (orange), once it is greater than 90 and a sell K-line pattern appears, the position will be lightened; the 95 clearing line (red) means that selling is at a climax. This is seen from the daily and weekly cycles, and small cycles may not be suitable.
2. The purple band indicates that the momentum is sufficient to hold a position, and the green band indicates that the momentum is insufficient and the position is short.
3. Divide the RMI into 7, 14, and 21 cycles. When the golden fork appears in the two resonances, a golden fork will appear to prompt you to buy, and when the two periods of resonance have a dead fork, a purple fork will appear to prompt you to sell.
4. Add top-bottom divergence judgment algorithm. Top_Div red label indicates top divergence; Bot_Div green label indicates bottom divergence. These signals are only for auxiliary judgment and are not 100% accurate.
5. This indicator needs to be combined with VOL energy, K-line shape and moving average for comprehensive judgment. It is still in its infancy, and open source is published in the TradingView community. A more complete advanced version is also considered for subsequent release (because the K-line pattern recognition algorithm is still being perfected).
Remarks
Feedbacks are appreciated.

Relative Index StrengthThis script shows relative strength of custom stock compared to Index. It is helpful in detecting how strongly a stock is performing when compared to an Index.
When the index is falling but the custom stock is rising, indicator shows this in red with its relative strength compared to index, indicating the stock is moving strongly against market trend.
When the index and the custom stock are moving in same direction, indicator remains neutral, indicating the stock is aligned with the market trend.
RSI/RSX QQE Histogram w/ Discontinued Signal Line [Loxx]QQE Histogram w/ Discontinued Signal Line is a run-of-the-mill Qualitative Quantitative Estimation (QQE) calculation but with a signal line to better filter and identify trends. The thicker white line is the QSL and appears as a simple EMA. The two thin white lines are the fast and slow trends. The histogram changes color based on the DSL levels. This version of QQE also includes two different versions of RSI: Wilders and Jurik's RSX.
What is Qualitative Quantitative Estimation (QQE)?
The Qualitative Quantitative Estimation (QQE) indicator works like a smoother version of the popular Relative Strength Index ( RSI ) indicator. QQE expands on RSI by adding two volatility based trailing stop lines. These trailing stop lines are composed of a fast and a slow moving Average True Range (ATR).
What is Wilders' RSI?
The Relative Strength Index (RSI) is a well versed momentum based oscillator which is used to measure the speed (velocity) as well as the change (magnitude) of directional price movements. Essentially RSI , when graphed, provides a visual mean to monitor both the current, as well as historical, strength and weakness of a particular market. The strength or weakness is based on closing prices over the duration of a specified trading period creating a reliable metric of price and momentum changes. Given the popularity of cash settled instruments (stock indexes) and leveraged financial products (the entire field of derivatives); RSI has proven to be a viable indicator of price movements.
What is RSX?
RSI is a very popular technical indicator, because it takes into consideration market speed, direction and trend uniformity. However, the its widely criticized drawback is its noisy (jittery) appearance. The Jurk RSX retains all the useful features of RSI , but with one important exception: the noise is gone with no added lag.
There are many indicators for many purposes. Some of them are complex and some are comparatively easy to handle. The QQE indicator is a really useful analytical tool and one of the most accurate indicators. It offers numerous strategies for using the buy and sell signals. Essentially, it can help detect trend reversal and enter the trade at the most optimal positions.
Included:
-Toggle on/off bar coloring

Adaptivity: Measures of Dominant Cycles and Price Trend [Loxx]Adaptivity: Measures of Dominant Cycles and Price Trend is an indicator that outputs adaptive lengths using various methods for dominant cycle and price trend timeframe adaptivity. While the information output from this indicator might be useful for the average trader in one off circumstances, this indicator is really meant for those need a quick comparison of dynamic length outputs who wish to fine turn algorithms and/or create adaptive indicators.
This indicator compares adaptive output lengths of all publicly known adaptive measures. Additional adaptive measures will be added as they are discovered and made public.
The first released of this indicator includes 6 measures. An additional three measures will be added with updates. Please check back regularly for new measures.
Ehers:
Autocorrelation Periodogram
Band-pass
Instantaneous Cycle
Hilbert Transformer
Dual Differentiator
Phase Accumulation (future release)
Homodyne (future release)
Jurik:
Composite Fractal Behavior (CFB)
Adam White:
Veritical Horizontal Filter (VHF) (future release)
What is an adaptive cycle, and what is Ehlers Autocorrelation Periodogram Algorithm?
From his Ehlers' book Cycle Analytics for Traders Advanced Technical Trading Concepts by John F. Ehlers , 2013, page 135:
"Adaptive filters can have several different meanings. For example, Perry Kaufman's adaptive moving average (KAMA) and Tushar Chande's variable index dynamic average (VIDYA) adapt to changes in volatility . By definition, these filters are reactive to price changes, and therefore they close the barn door after the horse is gone.The adaptive filters discussed in this chapter are the familiar Stochastic , relative strength index (RSI), commodity channel index (CCI), and band-pass filter.The key parameter in each case is the look-back period used to calculate the indicator. This look-back period is commonly a fixed value. However, since the measured cycle period is changing, it makes sense to adapt these indicators to the measured cycle period. When tradable market cycles are observed, they tend to persist for a short while.Therefore, by tuning the indicators to the measure cycle period they are optimized for current conditions and can even have predictive characteristics.
The dominant cycle period is measured using the Autocorrelation Periodogram Algorithm. That dominant cycle dynamically sets the look-back period for the indicators. I employ my own streamlined computation for the indicators that provide smoother and easier to interpret outputs than traditional methods. Further, the indicator codes have been modified to remove the effects of spectral dilation.This basically creates a whole new set of indicators for your trading arsenal."
What is this Hilbert Transformer?
An analytic signal allows for time-variable parameters and is a generalization of the phasor concept, which is restricted to time-invariant amplitude, phase, and frequency. The analytic representation of a real-valued function or signal facilitates many mathematical manipulations of the signal. For example, computing the phase of a signal or the power in the wave is much simpler using analytic signals.
The Hilbert transformer is the technique to create an analytic signal from a real one. The conventional Hilbert transformer is theoretically an infinite-length FIR filter. Even when the filter length is truncated to a useful but finite length, the induced lag is far too large to make the transformer useful for trading.
From his Ehlers' book Cycle Analytics for Traders Advanced Technical Trading Concepts by John F. Ehlers , 2013, pages 186-187:
"I want to emphasize that the only reason for including this section is for completeness. Unless you are interested in research, I suggest you skip this section entirely. To further emphasize my point, do not use the code for trading. A vastly superior approach to compute the dominant cycle in the price data is the autocorrelation periodogram. The code is included because the reader may be able to capitalize on the algorithms in a way that I do not see. All the algorithms encapsulated in the code operate reasonably well on theoretical waveforms that have no noise component. My conjecture at this time is that the sample-to-sample noise simply swamps the computation of the rate change of phase, and therefore the resulting calculations to find the dominant cycle are basically worthless.The imaginary component of the Hilbert transformer cannot be smoothed as was done in the Hilbert transformer indicator because the smoothing destroys the orthogonality of the imaginary component."
What is the Dual Differentiator, a subset of Hilbert Transformer?
From his Ehlers' book Cycle Analytics for Traders Advanced Technical Trading Concepts by John F. Ehlers , 2013, page 187:
"The first algorithm to compute the dominant cycle is called the dual differentiator. In this case, the phase angle is computed from the analytic signal as the arctangent of the ratio of the imaginary component to the real component. Further, the angular frequency is defined as the rate change of phase. We can use these facts to derive the cycle period."
What is the Phase Accumulation, a subset of Hilbert Transformer?
From his Ehlers' book Cycle Analytics for Traders Advanced Technical Trading Concepts by John F. Ehlers , 2013, page 189:
"The next algorithm to compute the dominant cycle is the phase accumulation method. The phase accumulation method of computing the dominant cycle is perhaps the easiest to comprehend. In this technique, we measure the phase at each sample by taking the arctangent of the ratio of the quadrature component to the in-phase component. A delta phase is generated by taking the difference of the phase between successive samples. At each sample we can then look backwards, adding up the delta phases.When the sum of the delta phases reaches 360 degrees, we must have passed through one full cycle, on average.The process is repeated for each new sample.
The phase accumulation method of cycle measurement always uses one full cycle's worth of historical data.This is both an advantage and a disadvantage.The advantage is the lag in obtaining the answer scales directly with the cycle period.That is, the measurement of a short cycle period has less lag than the measurement of a longer cycle period. However, the number of samples used in making the measurement means the averaging period is variable with cycle period. longer averaging reduces the noise level compared to the signal.Therefore, shorter cycle periods necessarily have a higher out- put signal-to-noise ratio."
What is the Homodyne, a subset of Hilbert Transformer?
From his Ehlers' book Cycle Analytics for Traders Advanced Technical Trading Concepts by John F. Ehlers , 2013, page 192:
"The third algorithm for computing the dominant cycle is the homodyne approach. Homodyne means the signal is multiplied by itself. More precisely, we want to multiply the signal of the current bar with the complex value of the signal one bar ago. The complex conjugate is, by definition, a complex number whose sign of the imaginary component has been reversed."
What is the Instantaneous Cycle?
The Instantaneous Cycle Period Measurement was authored by John Ehlers; it is built upon his Hilbert Transform Indicator.
From his Ehlers' book Cybernetic Analysis for Stocks and Futures: Cutting-Edge DSP Technology to Improve Your Trading by John F. Ehlers, 2004, page 107:
"It is obvious that cycles exist in the market. They can be found on any chart by the most casual observer. What is not so clear is how to identify those cycles in real time and how to take advantage of their existence. When Welles Wilder first introduced the relative strength index (rsi), I was curious as to why he selected 14 bars as the basis of his calculations. I reasoned that if i knew the correct market conditions, then i could make indicators such as the rsi adaptive to those conditions. Cycles were the answer. I knew cycles could be measured. Once i had the cyclic measurement, a host of automatically adaptive indicators could follow.
Measurement of market cycles is not easy. The signal-to-noise ratio is often very low, making measurement difficult even using a good measurement technique. Additionally, the measurements theoretically involve simultaneously solving a triple infinity of parameter values. The parameters required for the general solutions were frequency, amplitude, and phase. Some standard engineering tools, like fast fourier transforms (ffs), are simply not appropriate for measuring market cycles because ffts cannot simultaneously meet the stationarity constraints and produce results with reasonable resolution. Therefore i introduced maximum entropy spectral analysis (mesa) for the measurement of market cycles. This approach, originally developed to interpret seismographic information for oil exploration, produces high-resolution outputs with an exceptionally short amount of information. A short data length improves the probability of having nearly stationary data. Stationary data means that frequency and amplitude are constant over the length of the data. I noticed over the years that the cycles were ephemeral. Their periods would be continuously increasing and decreasing. Their amplitudes also were changing, giving variable signal-to-noise ratio conditions. Although all this is going on with the cyclic components, the enduring characteristic is that generally only one tradable cycle at a time is present for the data set being used. I prefer the term dominant cycle to denote that one component. The assumption that there is only one cycle in the data collapses the difficulty of the measurement process dramatically."
What is the Band-pass Cycle?
From his Ehlers' book Cycle Analytics for Traders Advanced Technical Trading Concepts by John F. Ehlers , 2013, page 47:
"Perhaps the least appreciated and most underutilized filter in technical analysis is the band-pass filter. The band-pass filter simultaneously diminishes the amplitude at low frequencies, qualifying it as a detrender, and diminishes the amplitude at high frequencies, qualifying it as a data smoother. It passes only those frequency components from input to output in which the trader is interested. The filtering produced by a band-pass filter is superior because the rejection in the stop bands is related to its bandwidth. The degree of rejection of undesired frequency components is called selectivity. The band-stop filter is the dual of the band-pass filter. It rejects a band of frequency components as a notch at the output and passes all other frequency components virtually unattenuated. Since the bandwidth of the deep rejection in the notch is relatively narrow and since the spectrum of market cycles is relatively broad due to systemic noise, the band-stop filter has little application in trading."
From his Ehlers' book Cycle Analytics for Traders Advanced Technical Trading Concepts by John F. Ehlers , 2013, page 59:
"The band-pass filter can be used as a relatively simple measurement of the dominant cycle. A cycle is complete when the waveform crosses zero two times from the last zero crossing. Therefore, each successive zero crossing of the indicator marks a half cycle period. We can establish the dominant cycle period as twice the spacing between successive zero crossings."
What is Composite Fractal Behavior (CFB)?
All around you mechanisms adjust themselves to their environment. From simple thermostats that react to air temperature to computer chips in modern cars that respond to changes in engine temperature, r.p.m.'s, torque, and throttle position. It was only a matter of time before fast desktop computers applied the mathematics of self-adjustment to systems that trade the financial markets.
Unlike basic systems with fixed formulas, an adaptive system adjusts its own equations. For example, start with a basic channel breakout system that uses the highest closing price of the last N bars as a threshold for detecting breakouts on the up side. An adaptive and improved version of this system would adjust N according to market conditions, such as momentum, price volatility or acceleration.
Since many systems are based directly or indirectly on cycles, another useful measure of market condition is the periodic length of a price chart's dominant cycle, (DC), that cycle with the greatest influence on price action.
The utility of this new DC measure was noted by author Murray Ruggiero in the January '96 issue of Futures Magazine. In it. Mr. Ruggiero used it to adaptive adjust the value of N in a channel breakout system. He then simulated trading 15 years of D-Mark futures in order to compare its performance to a similar system that had a fixed optimal value of N. The adaptive version produced 20% more profit!
This DC index utilized the popular MESA algorithm (a formulation by John Ehlers adapted from Burg's maximum entropy algorithm, MEM). Unfortunately, the DC approach is problematic when the market has no real dominant cycle momentum, because the mathematics will produce a value whether or not one actually exists! Therefore, we developed a proprietary indicator that does not presuppose the presence of market cycles. It's called CFB (Composite Fractal Behavior) and it works well whether or not the market is cyclic.
CFB examines price action for a particular fractal pattern, categorizes them by size, and then outputs a composite fractal size index. This index is smooth, timely and accurate
Essentially, CFB reveals the length of the market's trending action time frame. Long trending activity produces a large CFB index and short choppy action produces a small index value. Investors have found many applications for CFB which involve scaling other existing technical indicators adaptively, on a bar-to-bar basis.
What is VHF Adaptive Cycle?
Vertical Horizontal Filter (VHF) was created by Adam White to identify trending and ranging markets. VHF measures the level of trend activity, similar to ADX DI. Vertical Horizontal Filter does not, itself, generate trading signals, but determines whether signals are taken from trend or momentum indicators. Using this trend information, one is then able to derive an average cycle length.

Jurik CFB Adaptive QQE [Loxx]Jurik CFB Adaptive QQE is a Double Jurik-Filtered, Composite Fractal Behavior (CFB) adaptive, Qualitative Quantitative Estimation indicator. This indicator includes both fixed and the CFB adaptive calculations as well as three different types of RSI calculations including Jurik's RSX.
What is Qualitative Quantitative Estimation (QQE)?
The Qualitative Quantitative Estimation (QQE) indicator works like a smoother version of the popular Relative Strength Index ( RSI ) indicator. QQE expands on RSI by adding two volatility based trailing stop lines. These trailing stop lines are composed of a fast and a slow moving Average True Range (ATR).
There are many indicators for many purposes. Some of them are complex and some are comparatively easy to handle. The QQE indicator is a really useful analytical tool and one of the most accurate indicators. It offers numerous strategies for using the buy and sell signals. Essentially, it can help detect trend reversal and enter the trade at the most optimal positions.
What is Wilders' RSI?
The Relative Strength Index ( RSI ) is a well versed momentum based oscillator which is used to measure the speed (velocity) as well as the change (magnitude) of directional price movements. Essentially RSI , when graphed, provides a visual mean to monitor both the current, as well as historical, strength and weakness of a particular market. The strength or weakness is based on closing prices over the duration of a specified trading period creating a reliable metric of price and momentum changes. Given the popularity of cash settled instruments (stock indexes) and leveraged financial products (the entire field of derivatives); RSI has proven to be a viable indicator of price movements.
What is RSX RSI?
RSI is a very popular technical indicator, because it takes into consideration market speed, direction and trend uniformity. However, the its widely criticized drawback is its noisy (jittery) appearance. The Jurk RSX retains all the useful features of RSI , but with one important exception: the noise is gone with no added lag.
What is Rapid RSI?
Rapid RSI Indicator, from Ian Copsey's article in the October 2006 issue of Stocks & Commodities magazine.
RapidRSI resembles Wilder's RSI , but uses a SMA instead of a WilderMA for internal smoothing of price change accumulators.
What is Composite Fractal Behavior (CFB)?
All around you mechanisms adjust themselves to their environment. From simple thermostats that react to air temperature to computer chips in modern cars that respond to changes in engine temperature, r.p.m.'s, torque, and throttle position. It was only a matter of time before fast desktop computers applied the mathematics of self-adjustment to systems that trade the financial markets.
Unlike basic systems with fixed formulas, an adaptive system adjusts its own equations. For example, start with a basic channel breakout system that uses the highest closing price of the last N bars as a threshold for detecting breakouts on the up side. An adaptive and improved version of this system would adjust N according to market conditions, such as momentum, price volatility or acceleration.
Since many systems are based directly or indirectly on cycles, another useful measure of market condition is the periodic length of a price chart's dominant cycle, (DC), that cycle with the greatest influence on price action.
The utility of this new DC measure was noted by author Murray Ruggiero in the January '96 issue of Futures Magazine. In it. Mr. Ruggiero used it to adaptive adjust the value of N in a channel breakout system. He then simulated trading 15 years of D-Mark futures in order to compare its performance to a similar system that had a fixed optimal value of N. The adaptive version produced 20% more profit!
This DC index utilized the popular MESA algorithm (a formulation by John Ehlers adapted from Burg's maximum entropy algorithm, MEM). Unfortunately, the DC approach is problematic when the market has no real dominant cycle momentum, because the mathematics will produce a value whether or not one actually exists! Therefore, we developed a proprietary indicator that does not presuppose the presence of market cycles. It's called CFB (Composite Fractal Behavior) and it works well whether or not the market is cyclic.
CFB examines price action for a particular fractal pattern, categorizes them by size, and then outputs a composite fractal size index. This index is smooth, timely and accurate
Essentially, CFB reveals the length of the market's trending action time frame. Long trending activity produces a large CFB index and short choppy action produces a small index value. Investors have found many applications for CFB which involve scaling other existing technical indicators adaptively, on a bar-to-bar basis.
What is Jurik Volty used in the Juirk Filter?
One of the lesser known qualities of Juirk smoothing is that the Jurik smoothing process is adaptive. "Jurik Volty" (a sort of market volatility ) is what makes Jurik smoothing adaptive. The Jurik Volty calculation can be used as both a standalone indicator and to smooth other indicators that you wish to make adaptive.
What is the Jurik Moving Average?
Have you noticed how moving averages add some lag (delay) to your signals? ... especially when price gaps up or down in a big move, and you are waiting for your moving average to catch up? Wait no more! JMA eliminates this problem forever and gives you the best of both worlds: low lag and smooth lines.
Ideally, you would like a filtered signal to be both smooth and lag-free. Lag causes delays in your trades, and increasing lag in your indicators typically result in lower profits. In other words, late comers get what's left on the table after the feast has already begun.
Included
-Toggle bar color on/off

Adaptive, Jurik-Filtered, Floating RSI [Loxx]Adaptive, Jurik-Filtered, Floating RSI is an adaptive RSI indicator that smooths the RSI signal with a Jurik Filter.
This indicator contains three different types of RSI. They are following.
Wilders' RSI:
The Relative Strength Index ( RSI ) is a well versed momentum based oscillator which is used to measure the speed (velocity) as well as the change (magnitude) of directional price movements. Essentially RSI , when graphed, provides a visual mean to monitor both the current, as well as historical, strength and weakness of a particular market. The strength or weakness is based on closing prices over the duration of a specified trading period creating a reliable metric of price and momentum changes. Given the popularity of cash settled instruments (stock indexes) and leveraged financial products (the entire field of derivatives); RSI has proven to be a viable indicator of price movements.
RSX RSI:
RSI is a very popular technical indicator, because it takes into consideration market speed, direction and trend uniformity. However, the its widely criticized drawback is its noisy (jittery) appearance. The Jurk RSX retains all the useful features of RSI , but with one important exception: the noise is gone with no added lag.
Rapid RSI:
Rapid RSI Indicator, from Ian Copsey's article in the October 2006 issue of Stocks & Commodities magazine.
RapidRSI resembles Wilder's RSI , but uses a SMA instead of a WilderMA for internal smoothing of price change accumulators.
This indicator also uses adaptive cycles to calculate input lengths
What is an adaptive cycle, and what is Ehlers Autocorrelation Periodogram Algorithm?
From his Ehlers' book Cycle Analytics for Traders Advanced Technical Trading Concepts by John F. Ehlers , 2013, page 135:
"Adaptive filters can have several different meanings. For example, Perry Kaufman’s adaptive moving average ( KAMA ) and Tushar Chande’s variable index dynamic average ( VIDYA ) adapt to changes in volatility . By definition, these filters are reactive to price changes, and therefore they close the barn door after the horse is gone.The adaptive filters discussed in this chapter are the familiar Stochastic , relative strength index ( RSI ), commodity channel index ( CCI ), and band-pass filter.The key parameter in each case is the look-back period used to calculate the indicator. This look-back period is commonly a fixed value. However, since the measured cycle period is changing, it makes sense to adapt these indicators to the measured cycle period. When tradable market cycles are observed, they tend to persist for a short while.Therefore, by tuning the indicators to the measure cycle period they are optimized for current conditions and can even have predictive characteristics.
The dominant cycle period is measured using the Autocorrelation Periodogram Algorithm. That dominant cycle dynamically sets the look-back period for the indicators. I employ my own streamlined computation for the indicators that provide smoother and easier to interpret outputs than traditional methods. Further, the indicator codes have been modified to remove the effects of spectral dilation.This basically creates a whole new set of indicators for your trading arsenal."
Lastly, RSI is filtered and smoothed using a Jurik Filter
What is Jurik Volty?
One of the lesser known qualities of Juirk smoothing is that the Jurik smoothing process is adaptive. "Jurik Volty" (a sort of market volatility ) is what makes Jurik smoothing adaptive. The Jurik Volty calculation can be used as both a standalone indicator and to smooth other indicators that you wish to make adaptive.
What is the Jurik Moving Average?
Have you noticed how moving averages add some lag (delay) to your signals? ... especially when price gaps up or down in a big move, and you are waiting for your moving average to catch up? Wait no more! JMA eliminates this problem forever and gives you the best of both worlds: low lag and smooth lines.
Ideally, you would like a filtered signal to be both smooth and lag-free. Lag causes delays in your trades, and increasing lag in your indicators typically result in lower profits. In other words, late comers get what's left on the table after the feast has already begun.
Usage
-Red fill color when RSI is in overbought zone means a possible bear trend is incoming
-Green fill color when RSI is in overbought zone means a possible bear trend is incoming
Included
-Bar coloring
Adaptive Qualitative Quantitative Estimation (QQE) [Loxx]Adaptive QQE is a fixed and cycle adaptive version of the popular Qualitative Quantitative Estimation (QQE) used by forex traders. This indicator includes varoius types of RSI caculations and adaptive cycle measurements to find tune your signal.
Qualitative Quantitative Estimation (QQE):
The Qualitative Quantitative Estimation (QQE) indicator works like a smoother version of the popular Relative Strength Index (RSI) indicator. QQE expands on RSI by adding two volatility based trailing stop lines. These trailing stop lines are composed of a fast and a slow moving Average True Range (ATR).
There are many indicators for many purposes. Some of them are complex and some are comparatively easy to handle. The QQE indicator is a really useful analytical tool and one of the most accurate indicators. It offers numerous strategies for using the buy and sell signals. Essentially, it can help detect trend reversal and enter the trade at the most optimal positions.
Wilders' RSI:
The Relative Strength Index ( RSI ) is a well versed momentum based oscillator which is used to measure the speed (velocity) as well as the change (magnitude) of directional price movements. Essentially RSI , when graphed, provides a visual mean to monitor both the current, as well as historical, strength and weakness of a particular market. The strength or weakness is based on closing prices over the duration of a specified trading period creating a reliable metric of price and momentum changes. Given the popularity of cash settled instruments (stock indexes) and leveraged financial products (the entire field of derivatives); RSI has proven to be a viable indicator of price movements.
RSX RSI:
RSI is a very popular technical indicator, because it takes into consideration market speed, direction and trend uniformity. However, the its widely criticized drawback is its noisy (jittery) appearance. The Jurk RSX retains all the useful features of RSI , but with one important exception: the noise is gone with no added lag.
Rapid RSI:
Rapid RSI Indicator, from Ian Copsey's article in the October 2006 issue of Stocks & Commodities magazine.
RapidRSI resembles Wilder's RSI , but uses a SMA instead of a WilderMA for internal smoothing of price change accumulators.
VHF Adaptive Cycle:
Vertical Horizontal Filter (VHF) was created by Adam White to identify trending and ranging markets. VHF measures the level of trend activity, similar to ADX DI. Vertical Horizontal Filter does not, itself, generate trading signals, but determines whether signals are taken from trend or momentum indicators. Using this trend information, one is then able to derive an average cycle length.
Band-pass Adaptive Cycle:
Even the most casual chart reader will be able to spot times when the market is cycling and other times when longer-term trends are in play. Cycling markets are ideal for swing trading however attempting to “trade the swing” in a trending market can be a recipe for disaster. Similarly, applying trend trading techniques during a cycling market can equally wreak havoc in your account. Cycle or trend modes can readily be identified in hindsight. But it would be useful to have an objective scientific approach to guide you as to the current market mode.
There are a number of tools already available to differentiate between cycle and trend modes. For example, measuring the trend slope over the cycle period to the amplitude of the cyclic swing is one possibility.
We begin by thinking of cycle mode in terms of frequency or its inverse, periodicity. Since the markets are fractal ; daily, weekly, and intraday charts are pretty much indistinguishable when time scales are removed. Thus it is useful to think of the cycle period in terms of its bar count. For example, a 20 bar cycle using daily data corresponds to a cycle period of approximately one month.
When viewed as a waveform, slow-varying price trends constitute the waveform's low frequency components and day-to-day fluctuations (noise) constitute the high frequency components. The objective in cycle mode is to filter out the unwanted components--both low frequency trends and the high frequency noise--and retain only the range of frequencies over the desired swing period. A filter for doing this is called a bandpass filter and the range of frequencies passed is the filter's bandwidth.
Included:
-Toggle on/off bar coloring
-Customize RSI signal using fixed, VHF Adaptive, and Band-pass Adaptive calculations
-Choose from three different RSI types
Visuals:
-Red/Green line is the moving average of RSI
-Thin white line is the fast trend
-Dotted yellow line is the slow trend
Happy trading!

KINSKI Multi Trend OscillatorThe Multi Trend Oscillator is a tool that combines the ratings of several indicators to facilitate the search for profitable trades. I was inspired by the excellent indicator "Technical Ratings" from Team TradingView to create an alternative with a technically new approach. Therefore, it is not a modified copy of the original, but newly conceived and implemented.
The recommendations of the indicator are based on the calculated ratings from the different indicators included in it. The special thing here is that all settings for the individual indicators can be changed according to your own needs and displayed as a histogram and MA line. This provides an excellent visual control of your own settings. Alarms are also triggered.
Criteria for determining the rating
Relative Strength Index (RSI)
Buy - Crossover oversold level and indicator < oversold level and rising
Sell - Crossunder oversold level and indicator >= oversold level and falling
Neutral - neither Buy nor Sell
Relative Strength Index (RSI) Laguerre
Buy - Crossover Oversold Level and Indicator < Oversold Level and rising
Sell - Crossunder oversold level and indicator >= oversold level and falling
Neutral - neither Buy nor Sell
Noise free Relative Strength Index (RSX)
Buy - Crossover Oversold Level and Indicator < Oversold Level and rising
Sell - Crossunder oversold level and indicator >= oversold level and falling
Neutral - neither Buy nor Sell
Money Flow Index (MFI)
Buy - Crossover Oversold Level and Indicator < Oversold Level and rising
Sell - Crossunder oversold level and indicator >= oversold level and falling
Neutral - neither Buy nor Sell
Commodity Channel Index (CCI)
Buy - Crossover Oversold Level and Indicator < Oversold Level and rising
Sell - Crossunder oversold level and indicator >= oversold level and falling
Neutral - neither Buy nor Sell
Moving Average Convergence/Divergence (MACD)
Buy - values of the main line > values of the signal line and rising
Sell - values of the main line < values of the signal line and falling
Neutral - neither Buy nor Sell
Klinger
Buy - indicator >= 0 and rising
Sell - indicator < 0 and falling
Neutral - neither Buy nor Sell
Average Directional Index (ADX)
Buy - indicator > 20 and +DI line crosses over the -DI line and rising
Sell - indicator > 20 and +DI line crosses below the -DI line and falling
Neutral - neither Buy nor Sell
Awesome Oscillator
Buy - Crossover 0 and values are greater than 0, or exceed the zero line
Sell - Crossunder 0 and values are lower than 0, or fall below the zero line
Neutral - neither Buy nor Sell
Ultimate Oscillator
Buy - Crossover oversold level and indicator < oversold level and rising
Sell - Crossunder oversold level and indicator >= oversold level and falling
Neutral - neither Buy nor Sell
Williams Percent Range
Buy - Crossover Oversold Level and Indicator < Oversold Level and rising
Sell - Crossunder Oversold Level and Indicator >= Oversold Level and falling
Neutral - neither Buy nor Sell
Momentum
Buy - Crossover 0 and indicator levels rising
Sell - Crossunder 0 and indicator values falling
Neutral - neither Buy nor Sell
Total Ratings
The numerical value of the rating "Sell" is 0, "Neutral" is 0 and "Buy" is 1. The total rating is calculated as the average of the ratings of the individual indicators and are determined according to the following criteria:
MaxCount = 12 (depending on whether other oscillators are added).
CompareSellStrong = MaxCount * 0.3
CompareMid = MaxCount * 0.5
CompareBuyStrong = MaxCount * 0.7
value <= CompareSellStrong - Strong Sell
value < CompareMid and value > CompareSellStrong - Sell
value == 6 - Neutral
value > CompareMid and value < CompareBuyStrong - Buy
value >= CompareBuyStrong - Strong Buy
Understanding the results
The Multi Trend Oscillator is designed so that its values fluctuate between 0 and currently 12 (maximum number of integrated indicators). Its values are displayed as a histogram with green, red and gray bars. The bars are gray when the value of the indicator is at half of the number of indicators used, currently 12. Increasingly saturated green bars indicate increasing values above 6, and increasingly saturated red bars indicate increasingly decreasing values below 6.
The table at the end of the histogram shows details (can be activated in the settings) about the overall rating and the individual indicators. Its color is determined by the rating value: gray for neutral, green for buy or strong buy, red for sell or strong sell.
The following alarms are triggered:
Multi Trend Oscillator: Sell
Multi Trend Oscillator: Strong Sell
Multi Trend Oscillator: Buy
Multi Trend Oscillator: Strong Buy

Cyclic RSI High Low With Noise Filter█ OVERVIEW
This indicator displays Cyclic Relative Strength Index based on Decoding the Hidden Market Rhythm, Part 1 written by Lars von Thienen.
To determine true or false for Overbought / Oversold are unnecessary, therefore these should be either strong or weak.
Noise for weak Overbought / Oversold can be filtered, especially for smaller timeframe.
█ FEATURES
Display calculated Cyclic Relative Strength Index.
Zigzag high low based on Cyclic Relative Strength Index.
Able to filter noise for high low.
█ LEGENDS
◍ Weak Overbought / Oversold
OB ▼ = Strong Overbought
OS ▲ = Strong Oversold
█ USAGE / TIPS
Recommend to be used for Harmonic Patterns such as XABCD and ABCD.
Condition 1 (XABCD) : When ▼ and ▲ exist side by side, usually this outline XA, while the next two ◍ can be BC.
Condition 2 (ABCD) : When ▼ and ▲ exist side by side, usually this outline AB, while the next one ◍ can be BC, strong ABCD.
Condition 3 (ABCD) : When ▼ or ▲ exist at Point A, the next two ◍ can be Point B and Point C, medium ABCD.
Condition 4 (ABCD) : When ◍ exist at Point a, the next two ◍ can be Point b and Point c, weak ABCD usually used as lower case as abcd.
█ CREDITS
LoneSomeTheBlue
WhenToTrade

pandas_taLibrary "pandas_ta"
Level: 3
Background
Today is the first day of 2022 and happy new year every tradingviewers! May health and wealth go along with you all the time. I use this chance to publish my 1st PINE v5 lib : pandas_ta
This is not a piece of cake like thing, which cost me a lot of time and efforts to build this lib. Beyond 300 versions of this script was iterated in draft.
Function
Library "pandas_ta"
PINE v5 Counterpart of Pandas TA - A Technical Analysis Library in Python 3 at github.com
The Original Pandas Technical Analysis (Pandas TA) is an easy to use library that leverages the Pandas package with more than 130 Indicators and Utility functions and more than 60 TA Lib Candlestick Patterns.
I realized most of indicators except Candlestick Patterns because tradingview built-in Candlestick Patterns are even more powerful!
I use this to verify pandas_ta python version indicators for myself, but I realize that maybe many may need similar lib for pine v5 as well.
Function Brief Descriptions (Pls find details in script comments)
bton --> Binary to number
wcp --> Weighted Closing Price (WCP)
counter --> Condition counter
xbt --> Between
ebsw --> Even Better SineWave (EBSW)
ao --> Awesome Oscillator (AO)
apo --> Absolute Price Oscillator (APO)
xrf --> Dynamic shifted values
bias --> Bias (BIAS)
bop --> Balance of Power (BOP)
brar --> BRAR (BRAR)
cci --> Commodity Channel Index (CCI)
cfo --> Chande Forcast Oscillator (CFO)
cg --> Center of Gravity (CG)
cmo --> Chande Momentum Oscillator (CMO)
coppock --> Coppock Curve (COPC)
cti --> Correlation Trend Indicator (CTI)
dmi --> Directional Movement Index(DMI)
er --> Efficiency Ratio (ER)
eri --> Elder Ray Index (ERI)
fisher --> Fisher Transform (FISHT)
inertia --> Inertia (INERTIA)
kdj --> KDJ (KDJ)
kst --> 'Know Sure Thing' (KST)
macd --> Moving Average Convergence Divergence (MACD)
mom --> Momentum (MOM)
pgo --> Pretty Good Oscillator (PGO)
ppo --> Percentage Price Oscillator (PPO)
psl --> Psychological Line (PSL)
pvo --> Percentage Volume Oscillator (PVO)
qqe --> Quantitative Qualitative Estimation (QQE)
roc --> Rate of Change (ROC)
rsi --> Relative Strength Index (RSI)
rsx --> Relative Strength Xtra (rsx)
rvgi --> Relative Vigor Index (RVGI)
slope --> Slope
smi --> SMI Ergodic Indicator (SMI)
sqz* --> Squeeze (SQZ) * NOTE: code sufferred from very strange error, code was commented.
sqz_pro --> Squeeze PRO(SQZPRO)
xfl --> Condition filter
stc --> Schaff Trend Cycle (STC)
stoch --> Stochastic (STOCH)
stochrsi --> Stochastic RSI (STOCH RSI)
trix --> Trix (TRIX)
tsi --> True Strength Index (TSI)
uo --> Ultimate Oscillator (UO)
willr --> William's Percent R (WILLR)
alma --> Arnaud Legoux Moving Average (ALMA)
xll --> Dynamic rolling lowest values
dema --> Double Exponential Moving Average (DEMA)
ema --> Exponential Moving Average (EMA)
fwma --> Fibonacci's Weighted Moving Average (FWMA)
hilo --> Gann HiLo Activator(HiLo)
hma --> Hull Moving Average (HMA)
hwma --> HWMA (Holt-Winter Moving Average)
ichimoku --> Ichimoku Kinkō Hyō (ichimoku)
jma --> Jurik Moving Average Average (JMA)
kama --> Kaufman's Adaptive Moving Average (KAMA)
linreg --> Linear Regression Moving Average (linreg)
mgcd --> McGinley Dynamic Indicator
rma --> wildeR's Moving Average (RMA)
sinwma --> Sine Weighted Moving Average (SWMA)
ssf --> Ehler's Super Smoother Filter (SSF) © 2013
supertrend --> Supertrend (supertrend)
xsa --> X simple moving average
swma --> Symmetric Weighted Moving Average (SWMA)
t3 --> Tim Tillson's T3 Moving Average (T3)
tema --> Triple Exponential Moving Average (TEMA)
trima --> Triangular Moving Average (TRIMA)
vidya --> Variable Index Dynamic Average (VIDYA)
vwap --> Volume Weighted Average Price (VWAP)
vwma --> Volume Weighted Moving Average (VWMA)
wma --> Weighted Moving Average (WMA)
zlma --> Zero Lag Moving Average (ZLMA)
entropy --> Entropy (ENTP)
kurtosis --> Rolling Kurtosis
skew --> Rolling Skew
xev --> Condition all
zscore --> Rolling Z Score
adx --> Average Directional Movement (ADX)
aroon --> Aroon & Aroon Oscillator (AROON)
chop --> Choppiness Index (CHOP)
xex --> Condition any
cksp --> Chande Kroll Stop (CKSP)
dpo --> Detrend Price Oscillator (DPO)
long_run --> Long Run
psar --> Parabolic Stop and Reverse (psar)
short_run --> Short Run
vhf --> Vertical Horizontal Filter (VHF)
vortex --> Vortex
accbands --> Acceleration Bands (ACCBANDS)
atr --> Average True Range (ATR)
bbands --> Bollinger Bands (BBANDS)
donchian --> Donchian Channels (DC)
kc --> Keltner Channels (KC)
massi --> Mass Index (MASSI)
natr --> Normalized Average True Range (NATR)
pdist --> Price Distance (PDIST)
rvi --> Relative Volatility Index (RVI)
thermo --> Elders Thermometer (THERMO)
ui --> Ulcer Index (UI)
ad --> Accumulation/Distribution (AD)
cmf --> Chaikin Money Flow (CMF)
efi --> Elder's Force Index (EFI)
ecm --> Ease of Movement (EOM)
kvo --> Klinger Volume Oscillator (KVO)
mfi --> Money Flow Index (MFI)
nvi --> Negative Volume Index (NVI)
obv --> On Balance Volume (OBV)
pvi --> Positive Volume Index (PVI)
dvdi --> Dual Volume Divergence Index (DVDI)
xhh --> Dynamic rolling highest values
pvt --> Price-Volume Trend (PVT)
Remarks
I also incorporated func descriptions and func test script in commented mode, you can test the functino with the embedded test script and modify them as you wish.
This is a Level 3 free and open source indicator library.
Feedbacks are appreciated.
This is not the end of pandas_ta lib publication, but it is start point with pine v5 lib function and I will add more and more funcs into this lib for my own indicators.
Function Name List:
bton()
wcp()
count()
xbt()
ebsw()
ao()
apo()
xrf()
bias()
bop()
brar()
cci()
cfo()
cg()
cmo()
coppock()
cti()
dmi()
er()
eri()
fisher()
inertia()
kdj()
kst()
macd()
mom()
pgo()
ppo()
psl()
pvo()
qqe()
roc()
rsi()
rsx()
rvgi()
slope()
smi()
sqz_pro()
xfl()
stc()
stoch()
stochrsi()
trix()
tsi()
uo()
willr()
alma()
wcx()
xll()
dema()
ema()
fwma()
hilo()
hma()
hwma()
ichimoku()
jma()
kama()
linreg()
mgcd()
rma()
sinwma()
ssf()
supertrend()
xsa()
swma()
t3()
tema()
trima()
vidya()
vwap()
vwma()
wma()
zlma()
entropy()
kurtosis()
skew()
xev()
zscore()
adx()
aroon()
chop()
xex()
cksp()
dpo()
long_run()
psar()
short_run()
vhf()
vortex()
accbands()
atr()
bbands()
donchian()
kc()
massi()
natr()
pdist()
rvi()
thermo()
ui()
ad()
cmf()
efi()
ecm()
kvo()
mfi()
nvi()
obv()
pvi()
dvdi()
xhh()
pvt()

Indicators Combination Framework v3 IND [DTU]Hello All,
This script is a framework to analyze and see the results by combine selected indicators for (long, short, longexit, shortexit) conditions.
I was designed this for beginners and users to facilitate to see effects of the technical indicators combinations on the chart WITH NO CODE
You can improve your strategies according the results of this system by connecting the framework to a strategy framework/template such as Pinecoder, Benson, daveatt or custom.
This is enhanced version of my previous indicator "Indicators & Conditions Test Framework "
Currently there are 93 indicators (23 newly added) connected over library. You can also import an External Indicator or add Custom indicator (In the source)
It is possible to change it from Indicator to strategy (simple one) by just remarking strategy parts in the source code and see real time profit of your combinations
Feel free to change or use it in your source
Special thanks goes to Pine wizards: Trading view (built-in Indicators), @Rodrigo, @midtownsk8rguy, @Lazybear, @Daveatt and others for their open source codes and contributions
SIMPLE USAGE
1. SETTING: Show Alerts= True (To see your entries and Exists)
2. Define your Indicators (ex: INDICATOR1: ema(close,14), INDICATOR2: ema(close,21), INDICATOR3: ema(close,200)
3. Define Your Combinations for long & Short Conditions
a. For Long: (INDICATOR1 crossover INDICATOR2) AND (INDICATOR3 < close)
b. For Short: (INDICATOR1 crossunder INDICATOR2) AND (INDICATOR3 > close)
4. Select Strategy/template (Import strategy to chart) that you export your signals from the list
5. Analyze the best profit by changing Indicators values
SOME INDICATORS DETAILS
Each Indicator includes:
- Factorization : Converting the selected indicator to Double, triple Quadruple such as EMA to DEMA, TEMA QEMA
- Log : Simple or log10 can be used for calculation on function entries
- Plot Type : You can overlay the indicator on the chart (such ema) or you can use stochastic/Percentrank approach to display in the variable hlines range
- Extended Parametes : You can use default parameters or you can use extended (P1,P2) parameters regarding to indicator type and your choice
- Color : You can define indicator color and line properties
- Smooth : you can enable swma smooth
- indicators : you can select one of the 93 function like ema(),rsi().. to define your indicator
- Source : you can select from already defined indicators (IND1-4), External Indicator (EXT), Custom Indicator (CUST), and other sources (close, open...)
CONDITION DETAILS
- There are are 4 type of conditions, long entry, short entry, long exit, short exit.
- Each condition are built up from 4 combinations that joined with "AND" & "OR" operators
- You can see the results by enabling show alerts check box
- If you only wants to enter long entry and long exit, just fill these conditions
- If "close on opposite" checkbox selected on settings, long entry will be closed on short entry and vice versa
COMBINATIONS DETAILS
- There are 4 combinations that joined with "AND" & "OR" operators for each condition
- combinations are built up from compare 1st entry with 2nd one by using operator
- 1st and 2nd entries includes already defined indicators (IND1-5), External Indicator (EXT), Custom Indicator (CUST), and other sources (close, open...)
- Operators are comparison values such as >,<, crossover,...
- 2nd entry include "VALUE" parameter that will use to compare 1st indicator with value area
- If 2nd indicator selected different than "VALUE", value are will mean previous value of the selection. (ex: value area= 2, 2nd entry=close, means close )
- Selecting "NONE" for the 1st entry will disable calculation of current and following combinations
JOINS DETAILS
- Each combination will join wiht the following one with the JOIN (AND, OR) operator (if the following one is not equal "NONE")
CUSTOM INDICATOR
- Custom Indicator defines harcoded in the source code.
- You can call it with "CUST" in the Indicator definition source or combination entries source
- You can change or implement your custom indicator by updating the source code
EXTERNAL INDICATOR
- You can import an external indicator by selecting it from the ext source.
- External Indicator should be already imported to the chart and it have an plot function to output its signal
EXPORTING SIGNAL
- You can export your result to an already defined strategy template such as Pine coders, Benson, Daveatt Strategy templates
- Or you can define your custom export for other future strategy templates
ALERTS
- By enabling show alerts checkbox, you can see long entry exits on the bottom, and short entry exits aon the top of the chart
ADDITIONAL INFO
- You can see all off the inputs descriptions in the tooltips. (You can also see the previous version for details)
- Availability to set start, end dates
- Minimize repainting by using security function options (Secure, Semi Secure, Repaint)
- Availability of use timeframes
-
Version 3 INDICATORS LIST (More to be added):
▼▼▼ OVERLAY INDICATORS ▼▼▼
alma(src,len,offset=0.85,sigma=6).-------Arnaud Legoux Moving Average
ama(src,len,fast=14,slow=100).-----------Adjusted Moving Average
accdist().-------------------------------Accumulation/distribution index.
cma(src,len).----------------------------Corrective Moving average
dema(src,len).---------------------------Double EMA (Same as EMA with 2 factor)
ema(src,len).----------------------------Exponential Moving Average
gmma(src,len).---------------------------Geometric Mean Moving Average
highest(src,len).------------------------Highest value for a given number of bars back.
hl2ma(src,len).--------------------------higest lowest moving average
hma(src,len).----------------------------Hull Moving Average.
lagAdapt(src,len,perclen=5,fperc=50).----Ehlers Adaptive Laguerre filter
lagAdaptV(src,len,perclen=5,fperc=50).---Ehlers Adaptive Laguerre filter variation
laguerre(src,len).-----------------------Ehlers Laguerre filter
lesrcp(src,len).-------------------------lowest exponential esrcpanding moving line
lexp(src,len).---------------------------lowest exponential expanding moving line
linreg(src,len,loffset=1).---------------Linear regression
lowest(src,len).-------------------------Lovest value for a given number of bars back.
mcginley(src, len.-----------------------McGinley Dynamic adjusts for market speed shifts, which sets it apart from other moving averages, in addition to providing clear moving average lines
percntl(src,len).------------------------percentile nearest rank. Calculates percentile using method of Nearest Rank.
percntli(src,len).-----------------------percentile linear interpolation. Calculates percentile using method of linear interpolation between the two nearest ranks.
previous(src,len).-----------------------Previous n (len) value of the source
pivothigh(src,BarsLeft=len,BarsRight=2).-Previous pivot high. src=src, BarsLeft=len, BarsRight=p1=2
pivotlow(src,BarsLeft=len,BarsRight=2).--Previous pivot low. src=src, BarsLeft=len, BarsRight=p1=2
rema(src,len).---------------------------Range EMA (REMA)
rma(src,len).----------------------------Moving average used in RSI. It is the exponentially weighted moving average with alpha = 1 / length.
sar(start=len, inc=0.02, max=0.02).------Parabolic SAR (parabolic stop and reverse) is a method to find potential reversals in the market price direction of traded goods.start=len, inc=p1, max=p2. ex: sar(0.02, 0.02, 0.02)
sma(src,len).----------------------------Smoothed Moving Average
smma(src,len).---------------------------Smoothed Moving Average
super2(src,len).-------------------------Ehlers super smoother, 2 pole
super3(src,len).-------------------------Ehlers super smoother, 3 pole
supertrend(src,len,period=3).------------Supertrend indicator
swma(src,len).---------------------------Sine-Weighted Moving Average
tema(src,len).---------------------------Triple EMA (Same as EMA with 3 factor)
tma(src,len).----------------------------Triangular Moving Average
vida(src,len).---------------------------Variable Index Dynamic Average
vwma(src,len).---------------------------Volume Weigted Moving Average
volstop(src,len,atrfactor=2).------------Volatility Stop is a technical indicator that is used by traders to help place effective stop-losses. atrfactor=p1
wma(src,len).----------------------------Weigted Moving Average
vwap(src_).------------------------------Volume Weighted Average Price (VWAP) is used to measure the average price weighted by volume
▼▼▼ NON OVERLAY INDICATORS ▼▼
adx(dilen=len, adxlen=14, adxtype=0).----adx. The Average Directional Index (ADX) is a used to determine the strength of a trend. len=>dilen, p1=adxlen (default=14), p2=adxtype 0:ADX, 1:+DI, 2:-DI (def:0)
angle(src,len).--------------------------angle of the series (Use its Input as another indicator output)
aroon(len,dir=0).------------------------aroon indicator. Aroons major function is to identify new trends as they happen.p1 = dir: 0=mid (default), 1=upper, 2=lower
atr(src,len).----------------------------average true range. RMA of true range.
awesome(fast=len=5,slow=34,type=0).------Awesome Oscilator is an indicator used to measure market momentum. defaults : fast=len= 5, p1=slow=34, p2=type: 0=Awesome, 1=difference
bbr(src,len,mult=1).---------------------bollinger %%
bbw(src,len,mult=2).---------------------Bollinger Bands Width. The Bollinger Band Width is the difference between the upper and the lower Bollinger Bands divided by the middle band.
cci(src,len).----------------------------commodity channel index
cctbbo(src,len).-------------------------CCT Bollinger Band Oscilator
change(src,len).-------------------------A.K.A. Momentum. Difference between current value and previous, source - source . is most commonly referred to as a rate and measures the acceleration of the price and/or volume of a security
cmf(len=20).-----------------------------Chaikin Money Flow Indicator used to measure Money Flow Volume over a set period of time. Default use is len=20
cmo(src,len).----------------------------Chande Momentum Oscillator. Calculates the difference between the sum of recent gains and the sum of recent losses and then divides the result by the sum of all price movement over the same period.
cog(src,len).----------------------------The cog (center of gravity) is an indicator based on statistics and the Fibonacci golden ratio.
copcurve(src,len).-----------------------Coppock Curve. was originally developed by Edwin Sedge Coppock (Barrons Magazine, October 1962).
correl(src,len).-------------------------Correlation coefficient. Describes the degree to which two series tend to deviate from their ta.sma values.
count(src,len).--------------------------green avg - red avg
cti(src,len).----------------------------Ehler s Correlation Trend Indicator by
dev(src,len).----------------------------ta.dev() Measure of difference between the series and its ta.sma
dpo(len).--------------------------------Detrended Price OScilator is used to remove trend from price.
efi(len).--------------------------------Elders Force Index (EFI) measures the power behind a price movement using price and volume.
eom(len=14,div=10000).-------------------Ease of Movement.It is designed to measure the relationship between price and volume.p1 = div: 10000= (default)
falling(src,len).------------------------ta.falling() Test if the `source` series is now falling for `length` bars long. (Use its Input as another indicator output)
fisher(len).-----------------------------Fisher Transform is a technical indicator that converts price to Gaussian normal distribution and signals when prices move significantly by referencing recent price data
histvol(len).----------------------------Historical volatility is a statistical measure used to analyze the general dispersion of security or market index returns for a specified period of time.
kcr(src,len,mult=2).---------------------Keltner Channels Range
kcw(src,len,mult=2).---------------------ta.kcw(). Keltner Channels Width. The Keltner Channels Width is the difference between the upper and the lower Keltner Channels divided by the middle channel.
klinger(type=len).-----------------------Klinger oscillator aims to identify money flow’s long-term trend. type=len: 0:Oscilator 1:signal
macd(src,len).---------------------------MACD (Moving Average Convergence/Divergence)
mfi(src,len).----------------------------Money Flow Index s a tool used for measuring buying and selling pressure
msi(len=10).-----------------------------Mass Index (def=10) is used to examine the differences between high and low stock prices over a specific period of time
nvi().-----------------------------------Negative Volume Index
obv().-----------------------------------On Balance Volume
pvi().-----------------------------------Positive Volume Index
pvt().-----------------------------------Price Volume Trend
ranges(src,upper=len, lower=-5).---------ranges of the source. src=src, upper=len, v1:lower=upper . returns: -1 source=upper otherwise 0
rising(src,len).-------------------------ta.rising() Test if the `source` series is now rising for `length` bars long. (Use its Input as another indicator output)
roc(src,len).----------------------------Rate of Change
rsi(src,len).----------------------------Relative strength Index
rvi(src,len).----------------------------The Relative Volatility Index (RVI) is calculated much like the RSI, although it uses high and low price standard deviation instead of the RSI’s method of absolute change in price.
smi_osc(src,len,fast=5, slow=34).--------smi Oscillator
smi_sig(src,len,fast=5, slow=34).--------smi Signal
stc(src,len,fast=23,slow=50).------------Schaff Trend Cycle (STC) detects up and down trends long before the MACD. Code imported from
stdev(src,len).--------------------------Standart deviation
trix(src,len) .--------------------------the rate of change of a triple exponentially smoothed moving average.
tsi(src,len).----------------------------The True Strength Index indicator is a momentum oscillator designed to detect, confirm or visualize the strength of a trend.
ultimateOsc(len.-------------------------Ultimate Oscillator indicator (UO) indicator is a technical analysis tool used to measure momentum across three varying timeframes
variance(src,len).-----------------------ta.variance(). Variance is the expectation of the squared deviation of a series from its mean (ta.sma), and it informally measures how far a set of numbers are spread out from their mean.
willprc(src,len).------------------------Williams %R
wad().-----------------------------------Williams Accumulation/Distribution.
wvad().----------------------------------Williams Variable Accumulation/Distribution.
HISTORY
v3.01
ADD: 23 new indicators added to indicators list from the library. Current Total number of Indicators are 93. (to be continued to adding)
ADD: 2 more Parameters (P1,P2) for indicator calculation added. Par:(Use Defaults) uses only indicator(Source, Length) with library's default parameters. Par:(Use Extra Parameters P1,P2) use indicator(Source,Length,p1,p2) with additional parameters if indicator needs.
ADD: log calculation (simple, log10) option added on indicator function entries
ADD: New Output Signals added for compatibility on exporting condition signals to different Strategy templates.
ADD: Alerts Added according to conditions results
UPD: Indicator source inputs now display with indicators descriptions
UPD: Most off the source code rearranged and some functions moved to the new library. Now system work like a little bit frontend/backend
UPD: Performance improvement made on factorization and other source code
UPD: Input GUI rearranged
UPD: Tooltips corrected
REM: Extended indicators removed
UPD: IND1-IND4 added to indicator data source. Now it is possible to create new indicators with the previously defined indicators value. ex: IND1=ema(close,14) and IND2=rsi(IND1,20) means IND2=rsi(ema(close,14),20)
UPD: Custom Indicator (CUST) added to indicator data source and Combination Indicator source.
UPD: Volume added to indicator data source and Combination Indicator source.
REM: Custom indicators removed and only one custom indicator left
REM: Plot Type "Org. Range (-1,1)" removed
UPD: angle, rising, falling type operators moved to indicator library

RSI Trend LineI took a concept similar to the "Adaptive RSI" to get the RSI overlaid on a price chart. The problem I have with the Adaptive RSI is to me it sticks too closely to price. I wanted something much more visually helpful that can provide actual tradable signals and strategies.
The orange line you are seeing is the "RSI Trend Line"
The further the RSI moves away from a value of 50 (the "zero line"), the more you see this orange line move away from price. This helps visualize the strength of price pushing away from a neutral value to a position of strength or weakness-- if orange is below price then relative strength is high; if orange is above price then relative strength is low. When price is equal to the orange RSI line, the RSI is at a value of 50.
In addition to the trend line, you can enable bands which reflect Overbought and Oversold levels . If you leave the responsiveness to a value of 1.0 and removed any smoothing, these should pretty accurately reflect an actual RSI chart topping the OB and OS lines (default 70 and 30, respectively). (They're still very close with different responsiveness and smoothing values)
The conversion or scaling of RSI value onto price comes with a bit of a quirk which I decided to leave to the user to determine how they want it applied. So the setting "Responsiveness" will impact the sort of aggressiveness of the RSI trend line as well as the the size of the bands. You could think of this in some ways as the OPPOSITE of the multiple setting on a Bollinger or Keltner band-- 1.0 will make for the widest band, 2.0 is the default and my preference, and you can move it up to a value of 5.0.
Here are some examples of how you could use the indicator for trade signals--
And here's my thought on the current state (as of 10/06) on indices with regards to this indicator-

Combo Backtest 123 Reversal & Relative Momentum Index This is combo strategies for get a cumulative signal.
First strategy
This System was created from the Book "How I Tripled My Money In The
Futures Market" by Ulf Jensen, Page 183. This is reverse type of strategies.
The strategy buys at market, if close price is higher than the previous close
during 2 days and the meaning of 9-days Stochastic Slow Oscillator is lower than 50.
The strategy sells at market, if close price is lower than the previous close price
during 2 days and the meaning of 9-days Stochastic Fast Oscillator is higher than 50.
Second strategy
The Relative Momentum Index (RMI) was developed by Roger Altman. Impressed
with the Relative Strength Index's sensitivity to the number of look-back
periods, yet frustrated with it's inconsistent oscillation between defined
overbought and oversold levels, Mr. Altman added a momentum component to the RSI.
As mentioned, the RMI is a variation of the RSI indicator. Instead of counting
up and down days from close to close as the RSI does, the RMI counts up and down
days from the close relative to the close x-days ago where x is not necessarily
1 as required by the RSI). So as the name of the indicator reflects, "momentum" is
substituted for "strength".
WARNING:
- For purpose educate only
- This script to change bars colors.
